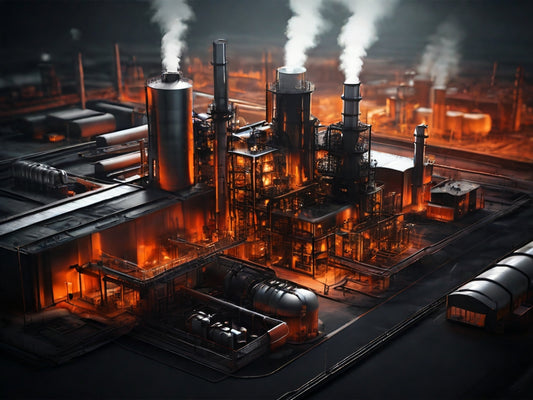
The Lincang Oil Depot Visualization Decision-Making Platform supports the data resources of existing information systems, deeply integrates cutting-edge technologies such as big data, AI, digital twins, integrated communications, etc., covering various business areas of the oil depot. With advanced human-machine interaction methods, it achieves a three-dimensional panoramic visualization of the plant area, visual management of resources, oil depot inspection, instrument inspection, data inspection, and other functions. It enables intelligent management and operation of the plant area, widely used in scenarios such as emergency command and data analysis. Digital twin is one of the top ten strategic technology trends, alongside artificial intelligence (AI) and machine learning (ML), which needs to be realized through comprehensive analysis and decision-making from bottom-up data to top-level.
Digital Twin Architecture Components 02 This platform realizes the practical application of digital twins through the three levels of linked service application layer, virtual simulation layer, and physical object layer.
Physical Object Layer: It utilizes IoT sensing technology and Cyber-Physical Systems to perceive, collect, and integrate multiple information elements of hardware and software resources. Real-time monitoring of various elements in the plant area is conducted through data collection devices such as RFID, wireless positioning, video systems, sensors, etc., capturing information on transportation in and out of the warehouse, storage conditions, inspection status, procurement and sales information, etc.
Virtual Simulation Layer: It simulates the data collected from the physical object layer, mapping the real-time situation of the plant area to a simulated environment. This helps in monitoring and analyzing assets, processes, and workflows to save time and money.
Linked Service Application Layer: It identifies and evaluates the system execution status and environmental dynamics. Through independent algorithms of various executing units (such as inspection path algorithms, oil-carrying vehicle scheduling algorithms, etc.), it reflects the optimal solution based on set goals on the visualization platform, thereby achieving the intelligence, visualization, and process control of the decision-making process.
How to Implement Digital Twins 03 Create a model of the plant area using software like Maya or 3ds Max (DCC), and map the real-world scenario to the virtual scene through access and connection to real-time data sources via RESTful APIs. Real-time IoT devices are essential for complete environment mapping, utilizing data collected from such devices for analysis, testing, optimization, and predictive checks. The 3D model for digital twins can be created through various methods such as laser scanning, photogrammetry, or graphic compiling software. Different software can be used for modeling different modules in the model to enhance performance efficiency of the overall model, especially in complex structures and demanding models. For instance, buildings without specific functions can be simply designed for appearance, important equipment can be modeled through DCC scanning, and various pipelines can be laid out and generated using professional pipeline software.
Oil Depot Visualization Inspection System 04 Based on the regional instrument operation status detection, monitoring of petroleum data online, real-time alarm data, and statistics on operating vehicles. Inspection personnel conduct detections along inspection routes, and when equipment malfunctions, an alert is issued, indicated by a red anomaly. Inspection personnel use on-site positioning devices for precise location tracking and real-time tracking of inspection paths and statuses. Typically, GPS signal positioning is used in projects, and location tracking can be achieved using personal mobile apps at a relatively low cost. For clients with high demands for information security, local positioning devices can be used for tracking the location of inspection personnel without connecting to external networks, which is then reflected on the visualization platform.
Digital Emergency Command Plan 05 Based on a three-dimensional map for functional development, the distribution of firefighting forces, key safety areas, firefighting water sources, incident alerts, dispatch records, distribution of key areas, road distribution, micro-fire stations, social emergency response forces, emergency reserve supplies, and emergency resource statistics are managed and displayed on the command screen. Information such as firefighting stations, social emergency response forces, emergency reserve supplies, and emergency resource statistics are managed and displayed on the command screen.
Environmental Visualization System 06 It visualizes the buildings, equipment, etc., in the oil depot and provides visual management means for various business systems, achieving centralized management of the oil depot environment to enhance control and management efficiency. Equipment in the plant area is monitored, and if a device failure is detected, it automatically switches to the scene of that device without the operator manually searching for the issue on the interface.
Technical Architecture 07 This solution utilizes industrial software platforms covering data collection from the bottom layer SCADA to MySQL data storage. The frontend uses Three.js and WebGL to achieve dynamic effects of mapping real-world scenarios to virtual environments (such as real-time location mapping of inspection personnel, mapping of situations like fires or equipment failures, etc.). Python is used for backend data processing, and various DCC software such as Maya, 3ds Max, Aveva are used for modeling, forming an integrated technical architecture solution.


